

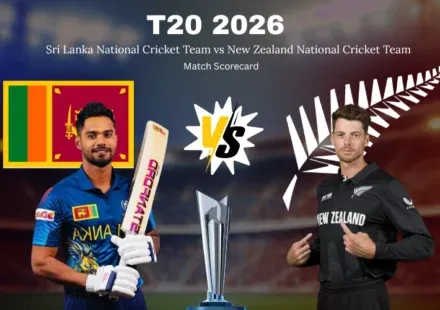
A cricket scorecard gives fans a quick way to understand the important numbers from a match without watching every single delivery. The website cricketstatking.com can be useful for readers who want cricket scorecards, match results, player statistics, team performances, and other details connected with the game. A scorecard may look crowded at first because several figures appear together, but most of those numbers have a simple purpose and become much easier once the basic sections are understood.
Start With Match Details
The first section of a scorecard generally provides information about the match itself. Readers can usually find the names of both teams, competition details, venue, match date, and the format being played.
This information is worth checking before looking at individual performances because cricket statistics depend heavily on the format. A score that looks impressive in T20 cricket may not have the same importance in a Test match.
The result section normally explains which team won the match and sometimes provides the exact winning margin. Some matches can finish as draws, ties, or no results, depending on what happened during the game.
Knowing the basic match information gives readers a proper starting point for understanding everything else shown on the scorecard.
Understand Team Score Numbers
The main team score usually appears in a format such as 184/6, where the first number represents runs and the second number represents wickets lost.
Therefore, 184/6 means the batting team scored 184 runs while losing six wickets. The second number does not mean six runs were deducted from the total.
Overs may appear next to the team score in limited-overs matches. A team finishing on 184/6 after twenty overs has completed its standard T20 innings.
In a fifty-over match, the same score after twenty overs would mean another thirty overs could remain under normal playing conditions.
This is why the score, wickets, and overs should always be read together rather than separately.
Read Batting Statistics Carefully
The batting section usually provides individual figures for every player who appeared during the innings. Common columns include runs, balls faced, fours, sixes, and strike rate.
Runs tell readers how many runs a batter personally scored.
Balls faced show how many deliveries that player received.
These two numbers together provide useful context. A batter scoring 70 runs from 45 balls has approached the innings differently from someone scoring 70 runs after facing 130 deliveries.
The boundary figures provide another layer of information because they show how many fours and sixes contributed to the score.
Some batters rely heavily on boundaries, while others rotate the strike and collect runs through quick running.
A complete batting assessment should therefore consider several figures together.
Strike Rate Shows Scoring Speed
Strike rate measures how quickly a batter scored compared with the number of balls faced. The standard calculation uses runs divided by balls faced, multiplied by one hundred.
For example, fifty runs from twenty-five balls produces a strike rate of 200.
That would normally represent very aggressive scoring in a limited-overs match.
Still, a high strike rate should not automatically be considered better in every situation. Test cricket often rewards patience because batters have enough time to build long innings.
A batter facing 150 balls in a Test match may be doing exactly what the team needs, especially when wickets are falling regularly at the other end.
In T20 cricket, however, scoring speed becomes much more important because the innings contains only twenty overs.
Dismissals Explain Falling Wickets
The dismissal section tells readers how individual batters lost their wickets. Common methods include caught, bowled, lbw, run out, stumped, and hit wicket.
A batter marked not out remained at the crease when the innings ended.
Dismissal information can sometimes explain the way an innings developed. Several catches may indicate aggressive batting or difficulty controlling attacking shots.
A run-out can result from risky running, poor communication, or excellent fielding from the opposition.
A stumping normally involves the wicketkeeper removing the bails while the batter is outside the crease.
These details may look small, but they help readers understand exactly how the wickets were taken.
Bowling Figures Tell Another Story
The bowling section normally contains overs, maidens, runs conceded, wickets, and economy rate for each bowler.
A bowling figure such as 8-1-36-3 generally means the bowler delivered eight overs, bowled one maiden, conceded 36 runs, and took three wickets.
The wickets column shows how many dismissals were credited to the bowler.
Runs conceded indicate how expensive the spell became.
Maidens show overs where the batting team did not score from that bowler under the relevant scoring rules.
These figures can quickly identify the bowlers who had the strongest statistical influence during an innings.
Economy Rate Measures Control
Economy rate shows the average number of runs conceded by a bowler per over. This figure is particularly useful in ODI and T20 cricket because scoring restrictions make run control important.
A bowler conceding 30 runs from six overs has an economy rate of five runs per over.
A lower economy generally indicates better control, but it does not automatically prove that the bowler was the best performer.
A bowler could concede more runs while taking several crucial wickets during the final overs.
Death-over bowlers often face aggressive batters who are trying to hit boundaries regularly.
Their economy figures may therefore look higher than those of bowlers operating during quieter stages.
Partnerships Show Team Recovery
Partnership figures show the number of runs scored between two wickets. They are useful for understanding how an innings changed after setbacks.
A team might fall to 30/3 before two batters build a partnership worth 110 runs.
The final score may look strong, but the partnership explains where the recovery actually happened.
Partnerships are especially important in Test cricket because long partnerships can consume time while steadily increasing the team’s total.
In T20 cricket, partnerships can change momentum much faster because fewer overs are available.
A strong partnership can also reduce pressure because batters can rotate the strike and share responsibility instead of trying to score every run individually.
Extras Add Important Runs
Extras are runs added to the team’s score that are not normally credited as ordinary batting runs.
The common categories include wides, no-balls, byes, and leg byes.
Wides can become costly because they generally give the batting side an additional run and require another delivery in many limited-overs situations.
No-balls can also provide extra runs and may lead to free-hit opportunities under the rules of the competition.
Byes occur when the ball passes the batter without being hit and also gets beyond the wicketkeeper or fielders.
Leg byes are recorded when the ball contacts the batter’s body under the conditions permitted by cricket’s laws.
Extras can make a noticeable difference during close matches.
Overs Explain Match Progress
Overs provide a basic measurement of how much of a limited-overs innings has already been completed.
A team scoring 100 runs after ten overs has been scoring at a much faster rate than a team reaching the same total after eighteen overs.
This makes the over count especially useful when analyzing a chase.
Over-by-over information can also reveal when a team accelerated, when wickets interrupted progress, and when bowlers successfully controlled the scoring.
A few expensive overs can quickly change the expected final total.
Likewise, several quiet overs can create pressure because the batting side has fewer remaining opportunities to recover.
Required Run Rate Matters
The required run rate shows how quickly a chasing team needs to score to reach its target.
Suppose a team requires 120 runs from fifteen overs. It needs to maintain an average of eight runs per over.
That number changes constantly as the chase continues.
If the batting side scores heavily in the next few overs, the required rate falls.
If the team scores slowly and loses wickets, the pressure can increase.
Required run rate is particularly important in T20 and ODI cricket because there is a fixed amount of time available.
It also helps readers understand whether a batter’s scoring contribution is keeping the team close to its target.
Target Numbers Need Context
The target normally represents the score that the chasing team needs to reach in order to win.
If the first team scores 210 runs, the chasing side generally needs 211 runs to win under normal circumstances.
But the target alone does not tell readers whether the chase is comfortable.
The number of wickets remaining and overs available also matter.
A team needing forty runs from five overs with eight wickets available can have a reasonable chance.
Another team needing those same forty runs from five overs with only one wicket remaining faces a completely different situation.
This is why scorecards are most useful when multiple sections are considered together.
Winning Margins Explain Results
The winning margin provides additional information about how a match ended.
A team chasing successfully with six wickets still available may win by six wickets.
A team defending its total can win by the number of runs separating the two final scores.
Test matches can have different result descriptions because each side normally receives two innings.
An innings victory can occur when one team builds a substantial advantage and the opposition cannot overcome it across its innings.
The winning margin therefore provides more detail than simply saying one team won.
A close victory and a dominant victory can look very different when their scorecards are examined properly.
Test Match Scorecards Differ
Test cricket scorecards contain more information because both teams normally have two innings.
Readers need to examine the first innings and second innings of both teams before judging the complete match.
A batter may score a century in the first innings and then make a small score later.
Another player may contribute useful scores in both innings without reaching a century.
Bowling figures can also change because pitch conditions may develop over several days.
Declarations, follow-on situations, weather interruptions, and changing conditions can make Test scorecards more complicated.
This format rewards readers who pay attention to innings order and the overall match situation.
ODI Scorecards Show Strategy
One-Day cricket normally gives each team fifty overs, although weather or other circumstances can reduce the available overs.
The format requires teams to balance scoring quickly with protecting wickets.
Opening batters may concentrate on creating a solid beginning, while middle-order players manage the scoring rate through the central overs.
The final stages often become more aggressive because fewer deliveries remain.
These changes can be seen through strike rates, boundary counts, balls faced, and over-by-over scoring.
Bowling statistics can also reveal which bowlers successfully controlled important phases and which spells became expensive.
T20 Scorecards Move Quickly
T20 cricket places strong emphasis on scoring speed because each team normally receives only twenty overs.
Batters often attack from the beginning, while bowlers have limited opportunities to recover after an expensive over.
A batter scoring 42 runs from twenty balls may have created more immediate momentum than another player scoring 55 from fifty balls.
This is why strike rate is heavily discussed in T20 analysis.
Bowling economy also becomes extremely important because a single expensive over can add a large number of runs to the opposition total.
Wickets remain valuable because removing aggressive batters can stop scoring momentum.
Compare Batters Using Context
Comparing batters requires more than checking who scored the highest number of runs.
Runs, balls faced, strike rate, boundaries, innings played, opposition strength, pitch conditions, and match situation can all influence the value of a performance.
A batter scoring 65 during a difficult chase may make a more important contribution than someone scoring 100 during an easy situation.
Not-out scores should also be considered carefully because a player may have had limited opportunities to face deliveries.
Format matters too because batting expectations differ significantly between Test, ODI, and T20 cricket.
Multiple statistics usually provide a fairer comparison than one number.
Compare Bowlers More Fairly
Bowling comparisons should involve wickets, economy rate, runs conceded, overs, maidens, and the stage of the innings.
A bowler taking four wickets for sixty runs has produced a different spell from one taking four wickets for twenty-five runs.
However, the first bowler may have been operating during the death overs against aggressive batters.
A bowler’s role can influence statistics considerably.
Opening bowlers may receive movement from a new ball, while spinners can become important during middle overs.
Death bowlers face a different challenge because batters are usually searching for boundaries.
This makes context essential when comparing bowling performances.
Fielding Also Changes Matches
Fielding contributions can be extremely important even though they often receive less attention than batting and bowling statistics.
A difficult catch can remove an important batter at a crucial moment.
A fast throw can create a run-out and break a developing partnership.
A wicketkeeper can produce a stumping within seconds when a batter moves outside the crease.
Boundary saves can also prevent several runs during close matches.
Traditional scorecards may record dismissals but cannot capture every useful fielding action.
Therefore, scorecards provide an excellent statistical summary while still leaving some parts of the match to detailed observation.
Scorecards Help Match Analysis
A scorecard becomes particularly useful after the match because readers can revisit exact figures without watching the entire game again.
Fans can check who scored the most runs, which bowler took the key wickets, and which partnership became important.
Writers can use scorecard information when preparing match reports or cricket articles.
Analysts can compare multiple matches to identify repeated strengths and weaknesses.
Players and coaches can also study statistics when reviewing performances.
The more scorecards someone reads, the easier it becomes to notice patterns involving scoring rates, wicket timing, bowling control, and partnership building.
Avoid Judging One Statistic
One statistic rarely provides enough information to judge an entire cricket performance.
A batter’s runs should be considered with balls faced and strike rate.
A bowler’s wickets should be examined with economy and runs conceded.
A team’s final score should be considered alongside pitch conditions, opposition quality, weather, and match format.
For example, a total of 160 can be excellent on a difficult pitch but ordinary on a flat batting surface.
Likewise, conceding forty runs may be acceptable for a death bowler but expensive for someone expected to control the middle overs.
Numbers become meaningful when their circumstances are understood.
Accurate Scorecards Matter
Accurate scorecards are important when statistics are being used for comparisons, articles, records, or historical analysis.
One incorrect run can change a player’s strike rate, team total, average, or final winning margin.
A wrong wicket figure can similarly affect bowling records.
Matches involving rain reductions, shortened innings, super overs, declarations, or unusual playing conditions may require additional attention.
Readers should therefore check unusual statistics carefully before treating them as established facts.
Clear presentation also makes it easier to notice possible mistakes.
Scorecards Build Cricket Knowledge
Regularly reading scorecards can improve cricket knowledge without requiring advanced statistical training.
Terms such as strike rate, economy rate, partnership, extras, maiden over, required rate, and wickets lost become familiar through repeated exposure.
Readers also begin to understand why different formats create different expectations.
A Test batter can spend hours building an innings, while a T20 batter may need to make an impact within a handful of deliveries.
Bowlers also have different responsibilities depending on whether they operate with the new ball, during the middle overs, or at the end of an innings.
Scorecards provide a simple way to see these differences through numbers.
Use Data After Matches
A scorecard remains valuable even after the final ball has been bowled.
Fans may return to it later to check a memorable century, outstanding bowling spell, large partnership, or close chase.
Writers can use it to verify statistics before publishing match-related information.
Analysts can compare performances across different matches and identify trends.
The scorecard also creates a common reference point during discussions because readers can check the actual figures instead of relying only on memory.
This makes accurate scorecards useful for casual fans as well as people who follow cricket more seriously.
Final Thoughts On Cricket Scorecards
A cricket scorecard is much more than a list of runs and wickets because it provides a compact picture of how the entire match developed. Batting figures explain individual contributions, bowling statistics show control and breakthroughs, while partnerships reveal important periods of recovery or acceleration.
Extras, overs, required rates, targets, and winning margins add even more context to the final result. Different formats also require different expectations, so Test, ODI, and T20 performances should not always be judged using identical standards.
Once the basic sections become familiar, scorecards become much easier to read and compare. They help fans understand why a team won, where momentum changed, which players made important contributions, and how the final result developed.
For cricket followers looking for match scorecards, player statistics, team performances, results, and useful cricket information, visit cricketstatking.com and continue exploring the numbers behind the game.
Read also :-
pakistan national cricket team vs netherlands national cricket team match scorecard
australian men’s cricket team vs south africa national cricket team standings
sri lanka national cricket team vs australia national cricket team standings
sri lanka national cricket team vs australia national cricket team match scorecard
netherlands national cricket team vs pakistan national cricket team match scorecard
sikkim cricket team vs mumbai cricket team timeline
pakistan national cricket team vs netherlands national cricket team match scorecard
लखनौ सुपर जायंट्स वि मुंबई इंडियन्स सामन्याचे स्कोअरकार्ड
sri lanka national cricket team vs australia national cricket team